Monday
ONE
Showed Marko sound sculpture idea. He loved it and wants us to develop it.
To do:
I need to find a suitable 3d printing image, called an stl file. If not, Francisco thinks we can make one from photogrammetry.
Need to finalise which whale. Frequency of occurrence, low frequency hearing and size are my critera. Size to inspire wonder at scale, low frequency to be relevant to tactile sound perception, and familiarity/ relevance to audiences in Madeira. Choices are still between blue whale: less common here, lower frequency and more awe inspiring; sperm whale: still large and fairly low frequency but more familiar.
I think it will be sperm whale. But finding an stl file will be a challenge, so I may have to go with whatever is available.
TWO
Talked to Laura about recording marine mammals. She’s interested in social calls. Showed me spectograms. I asked where is the ‘data’ according to her. She was very clear that she works from representations of the data not the data itself. The audio is useless on its own - human hearing cannot distinguish well enough what’s going on.
I found the spectograms very beautiful in their own right, even when, in Laura’s words, they were ‘a mess’. She meant because there were too many multiple subjects overlapping to make sense of what is going on. She’s interested in coda and cultures. Sperm whale for example communicate with other ecotypes (cultures?) but some other species stick to their own dialects. This is fascinating. Laura sent me a paper to read about this.
I asked about whether she ever re-sonifies the representations. She said no, and I didn’t get time to explain properly what I meant and why I was asking. I think this could be an interesting experiment perhaps for two reasons - one, scientifically to see if the audio would be reconstructed differently, and another artistically to see what (if anyting) might become apparent about the relationships between the codas or whatever, through a music-based approach.


She said bottlenose dolphins and pilot whales sometimes hang out together. They don’t know why. Could be dolphins’ way to get leftovers.
Laura gave me good article about non-human cultures focused on sperm whales.
Hersh, Taylor A., Shane Gero, Luke Rendell, Maurício Cantor, Lindy Weilgart, Masao Amano, Stephen M. Dawson, et al. "Evidence from Sperm Whale Clans of Symbolic Marking in Non-Human Cultures." Proceedings of the National Academy of Sciences 119, no. 37 (2022/09/13 2022): e2201692119. https://doi.org/10.1073/pnas.2201692119. https://doi.org/10.1073/pnas.2201692119.
THREE
Convo with Marko in response to my question about what a re-sonification of the data from the representation might reveal in the case of complicated and overlapping data. At first he thought I meant just reconstiting the audio (which might reveal flaws in the anti-aliasing or something about the omissions of the representation - which would be interesting in itself). This prompted him to talk about the different things that can be seen with different types of visualisations. For example, there are graphs which are called time series (see above top) and a fourier transformation like the spectograms I’ve already seen) and also a wavelet transformation that are different ways of visualising the same data that reveal diffent aspects of that data.
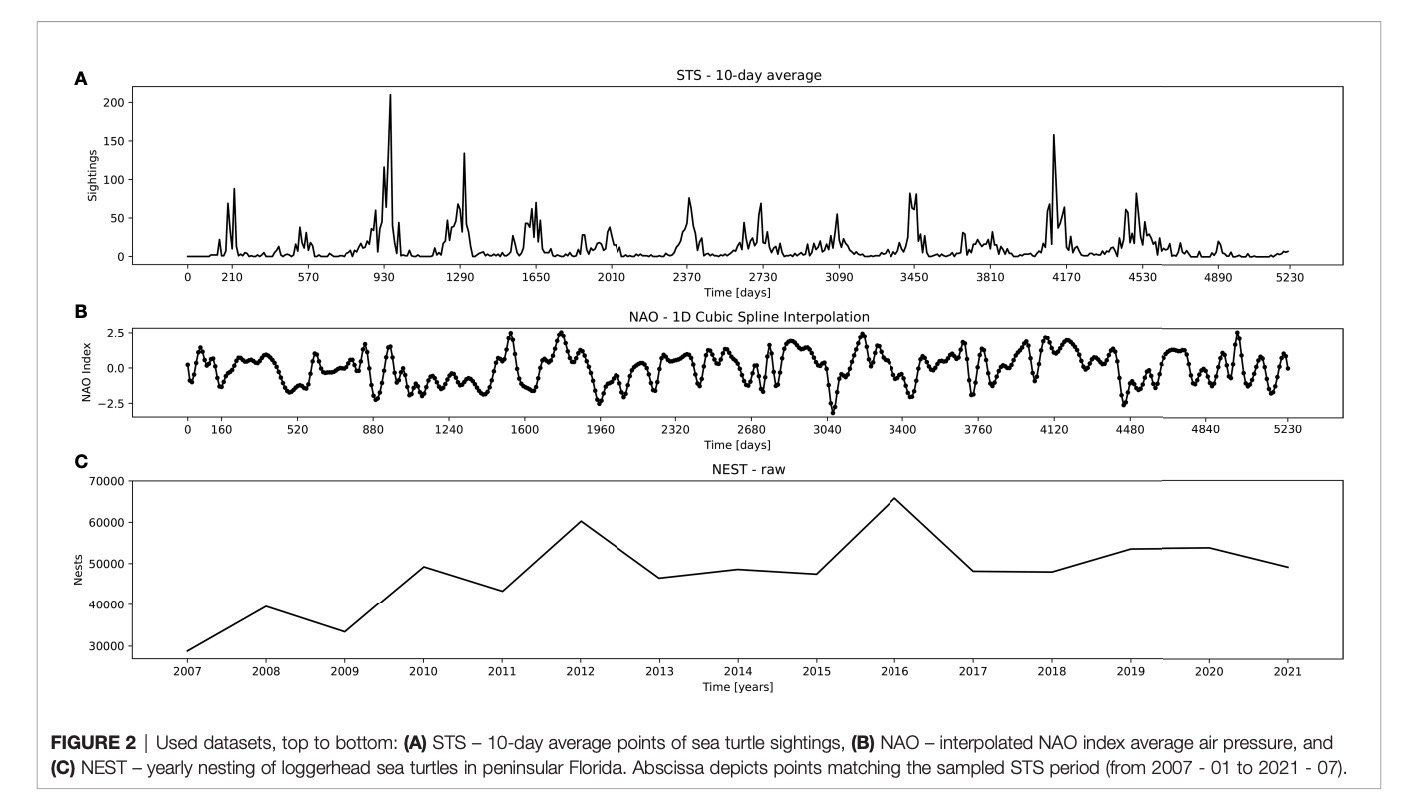
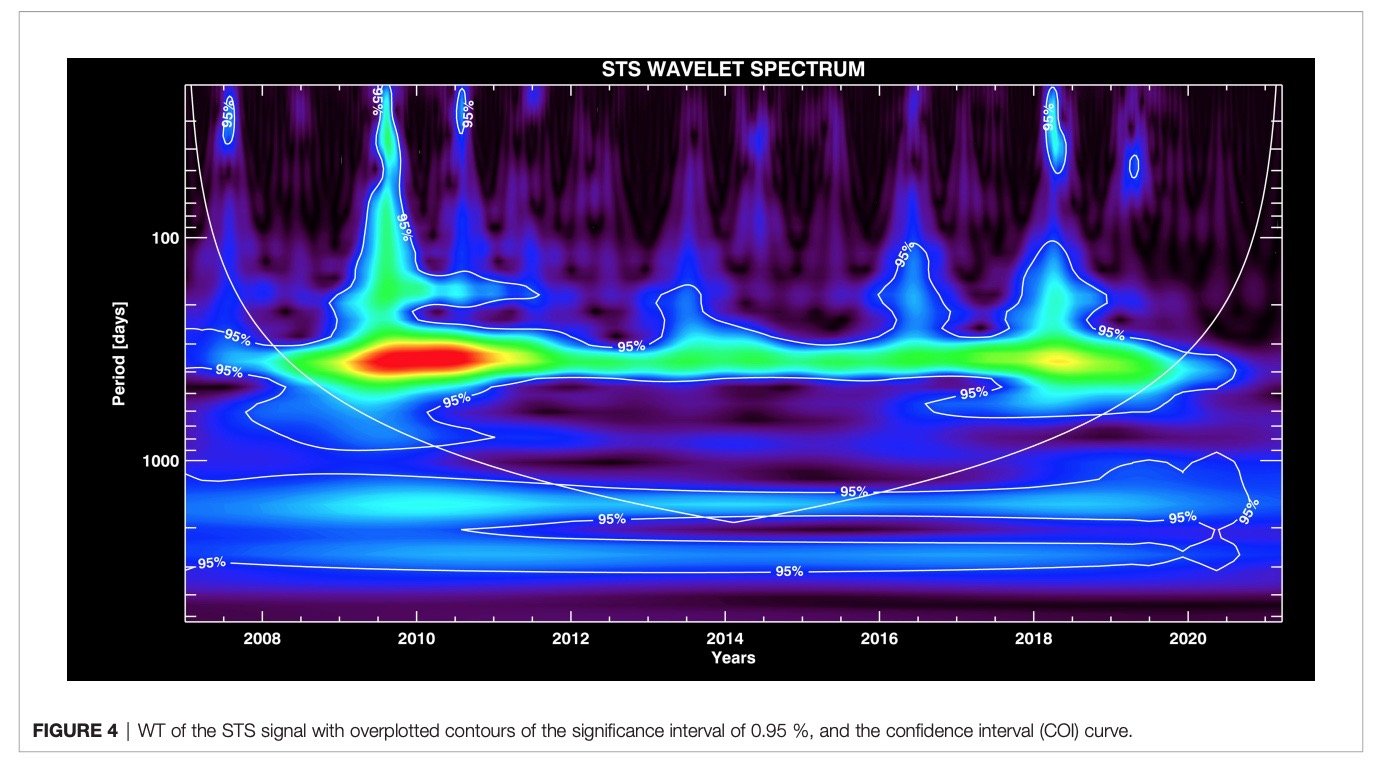
He gave me the example of a sea turtle study by Thomas Dillinger who sampled the quantity of loggerhead turtles present twice a day for fourteen years, from which the above images are taken. They used ten day averaging in a time series, then in fourier transformation (fft/ spectogram) and then also in a wavelets transformation. Time series just gives you the peaks and troughs over time, spectogram allows you to analyse those peaks and troughs as one thing - so gives you insight into the frequency of the peaks (how often the peaks occurred) eg in the case of turtles the peaks occurred once a year (every 365 days)) and the wavelet transformation allowed different less frequent peaks to be analysed. Thus showing that there were not only annual peaks but peaks that correlated with El-Nino for example.
Dellinger, Thomas, Vladimir Zekovic, and Marko Radeta. "Long-Term Monitoring of in-Water Abundance of Juvenile Pelagic Loggerhead Sea Turtles (Caretta Caretta): Population Trends in Relation to North Atlantic Oscillation and Nesting." [In English]. Original Research. Frontiers in Marine Science 9 (2022-July-27 2022). https://doi.org/10.3389/fmars.2022.877636. https://www.frontiersin.org/articles/10.3389/fmars.2022.877636.
To do:
Marko put me in touch with Raul Masu a composer he worked with, and recommended Denise Herzing underwater keyboard https://www.wilddolphinproject.org/our-research/chat-research/ ; Peter Gabriel, interspecies internet https://www.interspecies.io/about, and Diane Reiss, training vocal micmicry in bottlenose dolphins. [Reiss, D., & McCowan, B. (1993). Spontaneous vocal mimicry and production by bottlenose dolphins (Tursiops truncatus): Evidence for vocal learning. Journal of Comparative Psychology, 107(3), 301–312. https://doi.org/10.1037/0735-7036.107.3.301] https://www.youtube.com/watch?v=i0FiM50Uhzc
Tuesday

first field trip
October 31 2023.
On Tuesday I accompanied marine biologist PhD students Laura Redaelli and Eva Íñiguez Santamaría on a mission to record the vocalising of marine mammals.
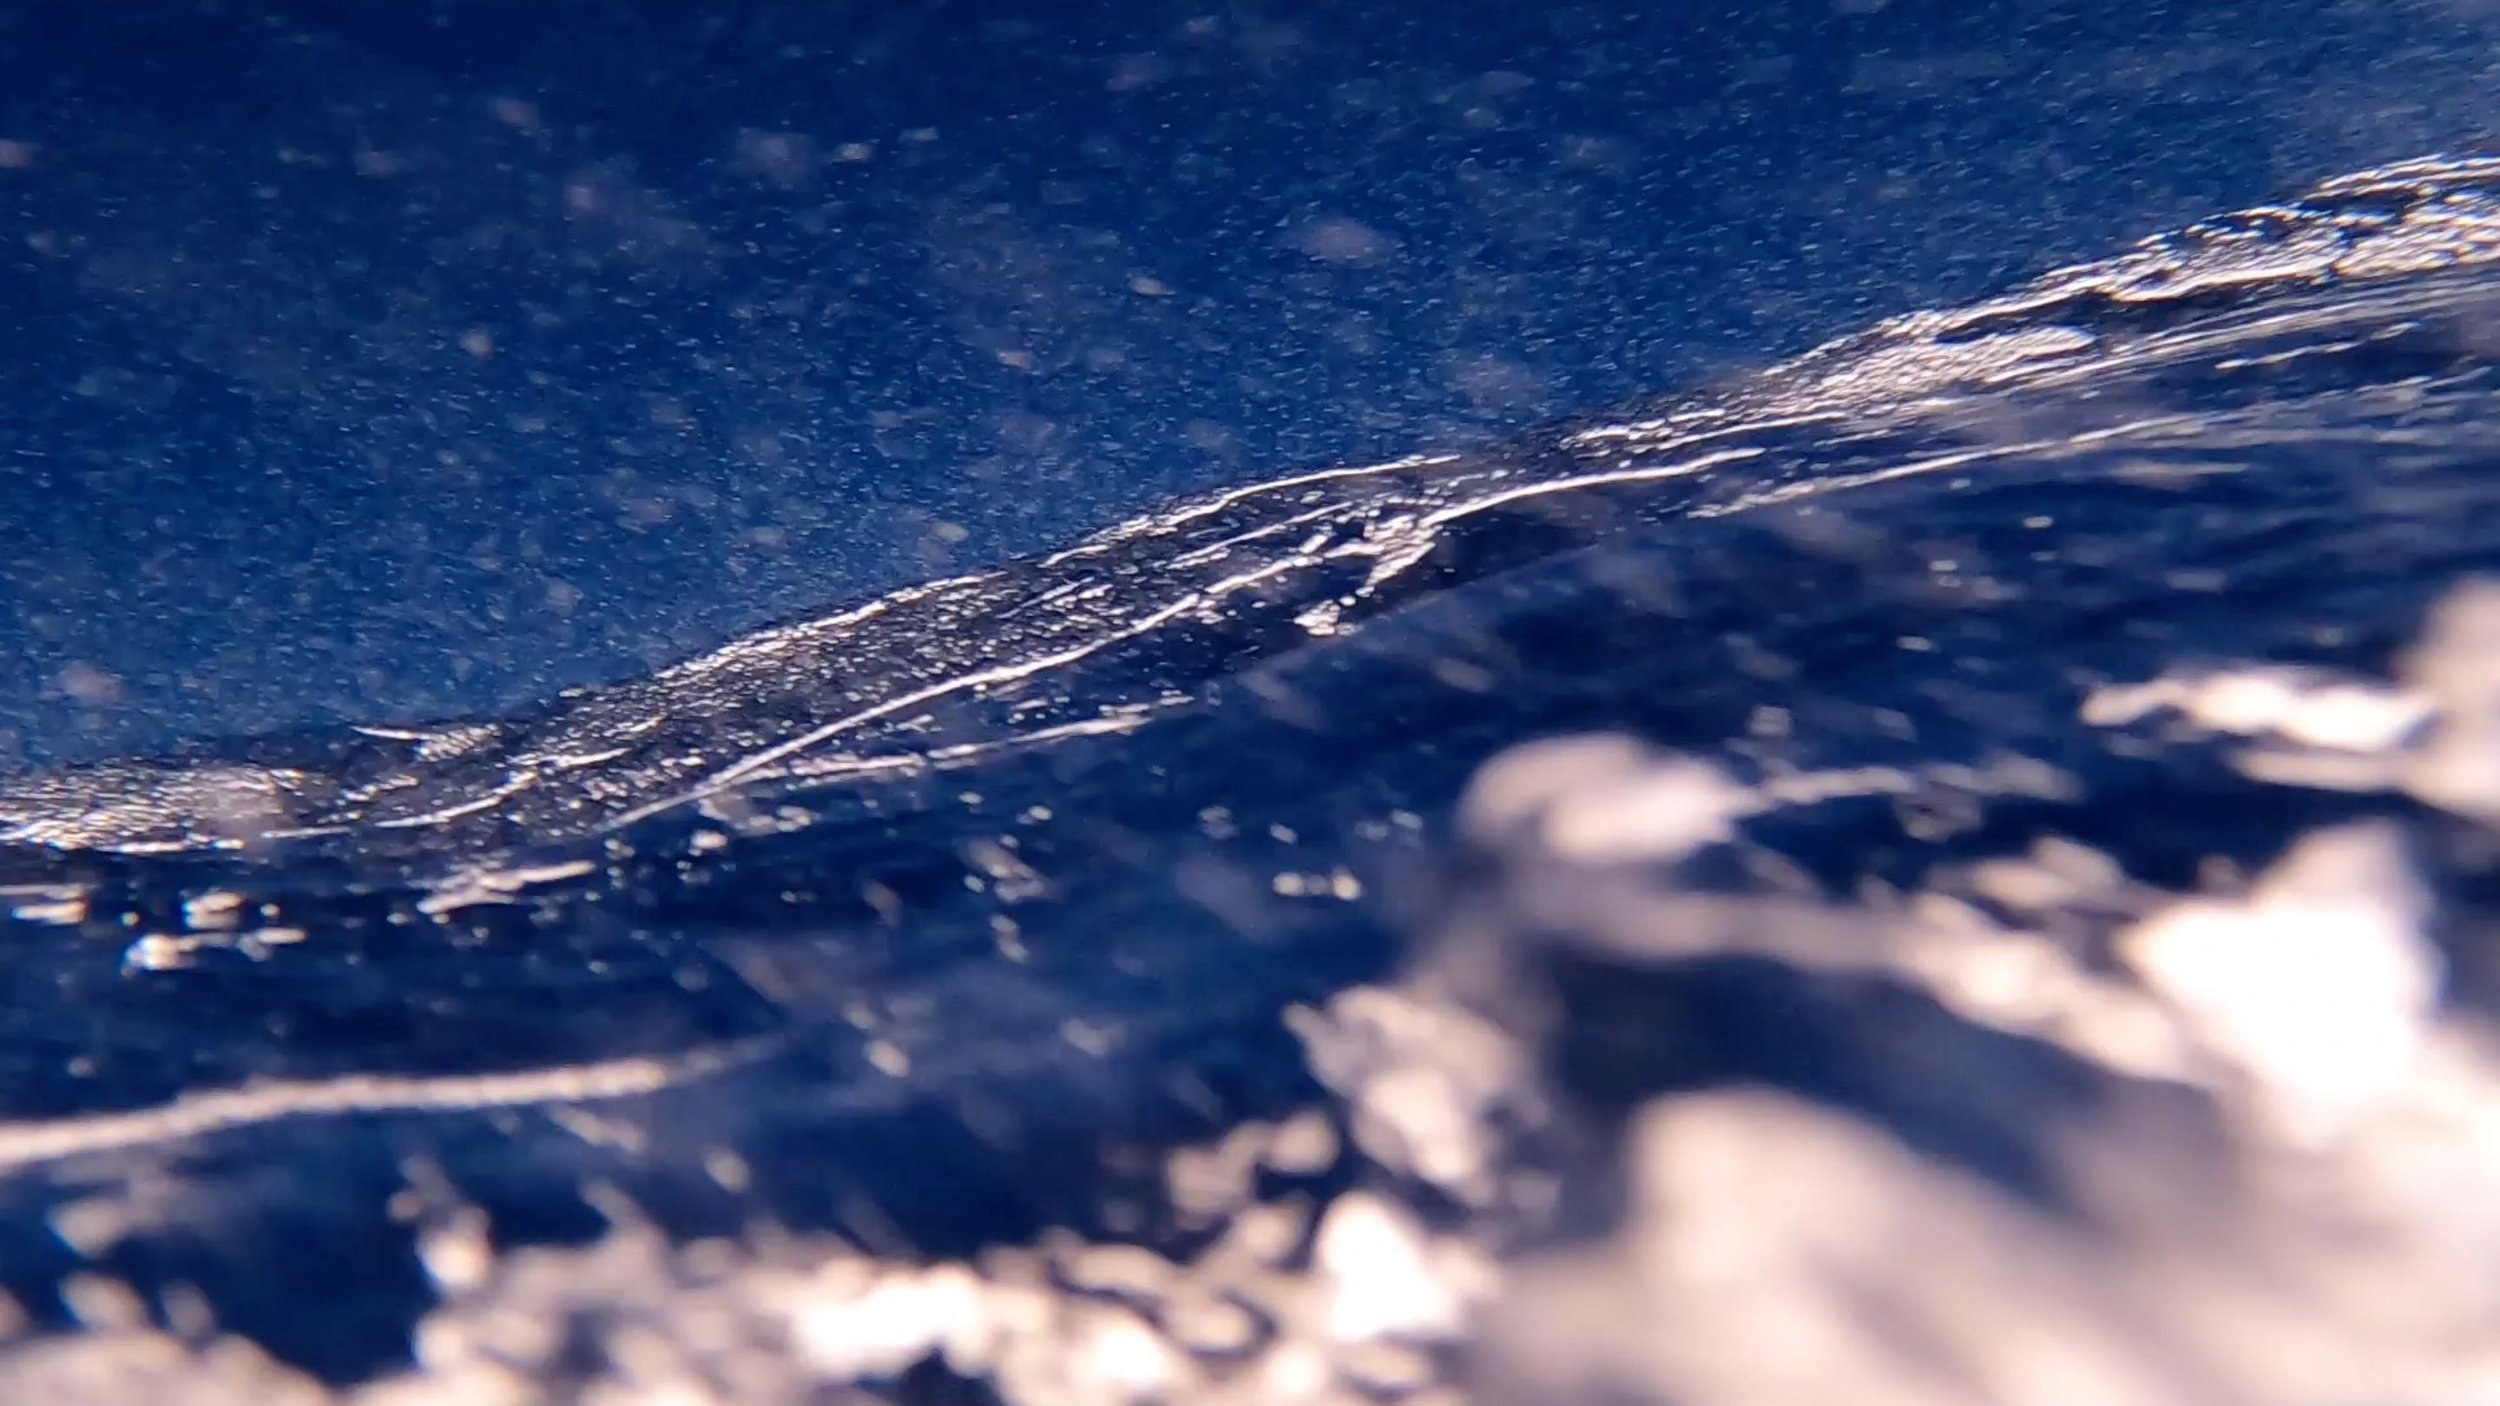
The weather was bad, so we only had a few minutes with engines turned off, recording some bottlenose dolphins, but I managed to take some GoPro footage under the surface while pursuing them. Laura explained that any ‘pursuit’ has to be conducted with sensitivity so as not to harass the animals. I asked how she did this and she told me she can tell from experience of observing their behaviour, such as when they begin to try to evade the boat for example.
I was relieved not to be seasick. One of the PhD researchers accompanying Eva was not so lucky, and spend most of the trip vomiting.
The trip clarified my recording strategy for next time. I like the under surface footage a lot and want to get more of it. Had to edit this because half of the time the camara was not underwater. Lesson from boat is things are frenetic, wet, not often still and you have to be ready to move quickly.
Therefore: next time I go on a trip have two simple goals 1. when moving focus on under surface video 2. when stopped focus on hydrophones - forget about air mics.
go pro on 60fps 4K so I can go to slomo in edit and zoom if necessary
Take longer pole and focus on undersea wave shots
have both hydrophones (mine and Wave Labs’) armed and ready to go over at same time, same side
Thursday
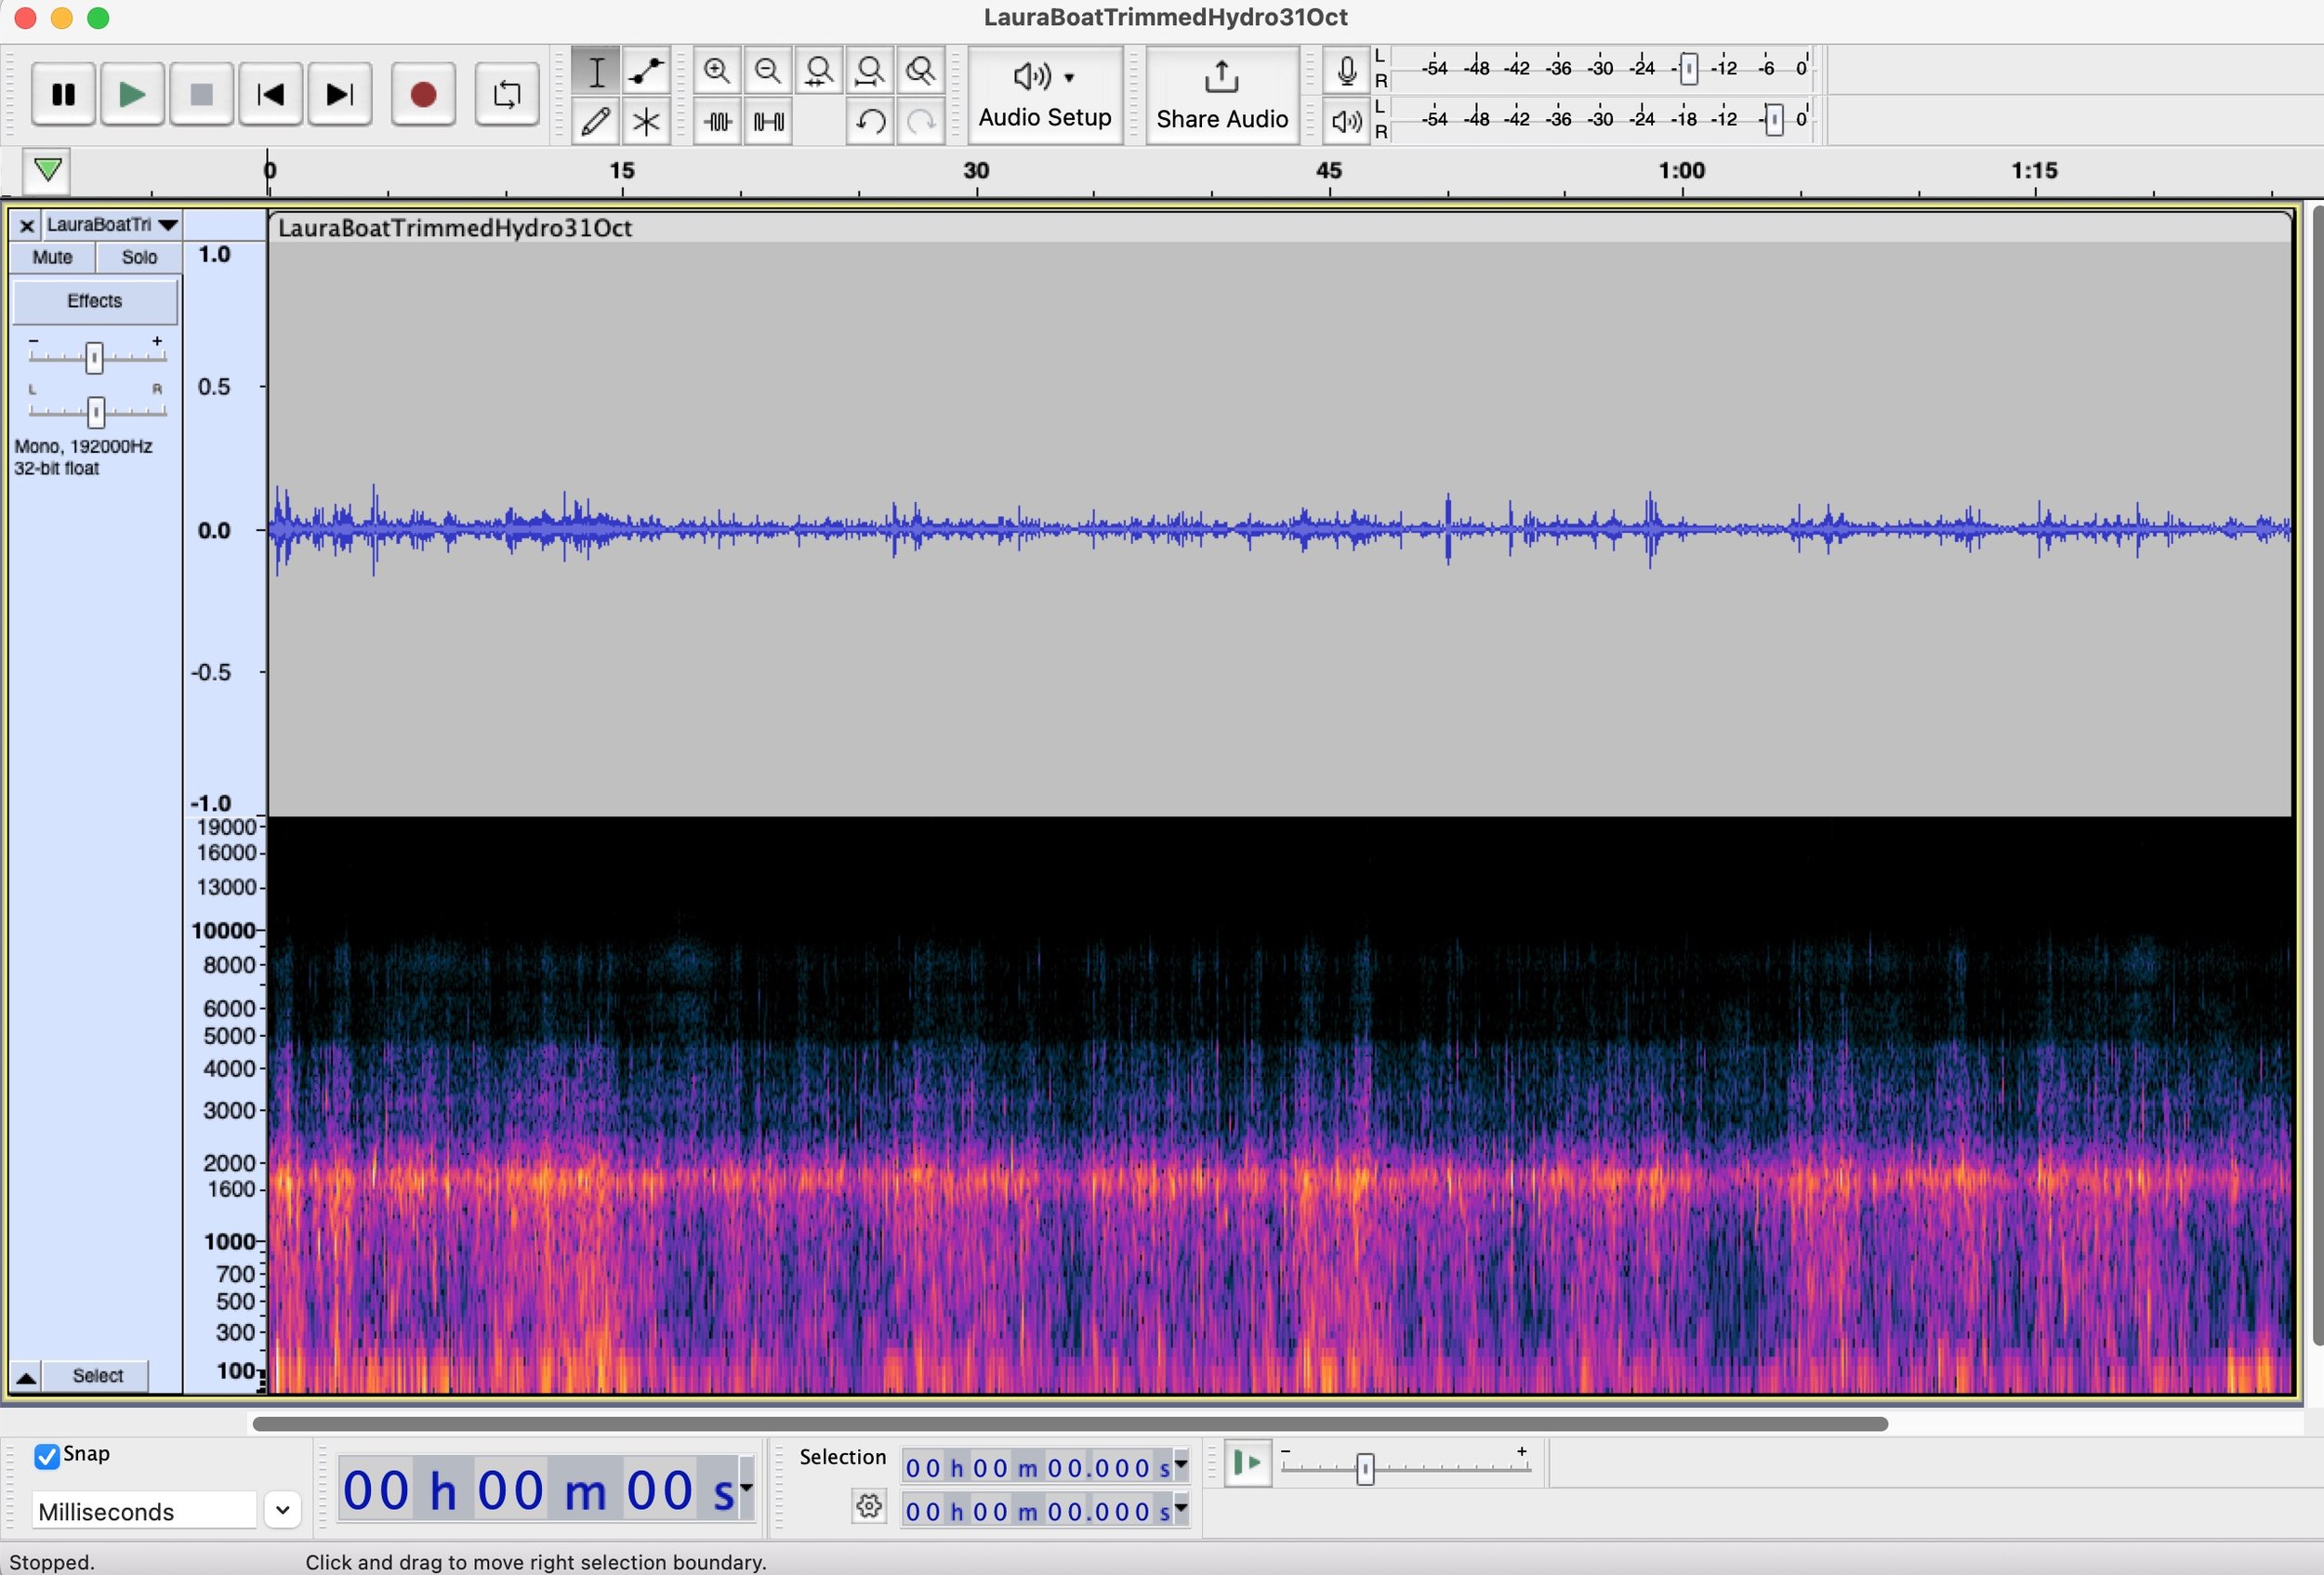
I found out how to produce a spectogram in audacity so as to be able to visually analyse a sound sample. Below is my short hydrophone recording from the side of the boat. There’s nothing particularly interesting about it but will serve as a control image/sound so that I know what nothing looks like! Next week I’ll start looking at/ listening to the samples Laura provided to Marko to train the AI filter in the Poseidon project, so that I can begin to recognise marine mammalian sounds by sight and ear.
Friday
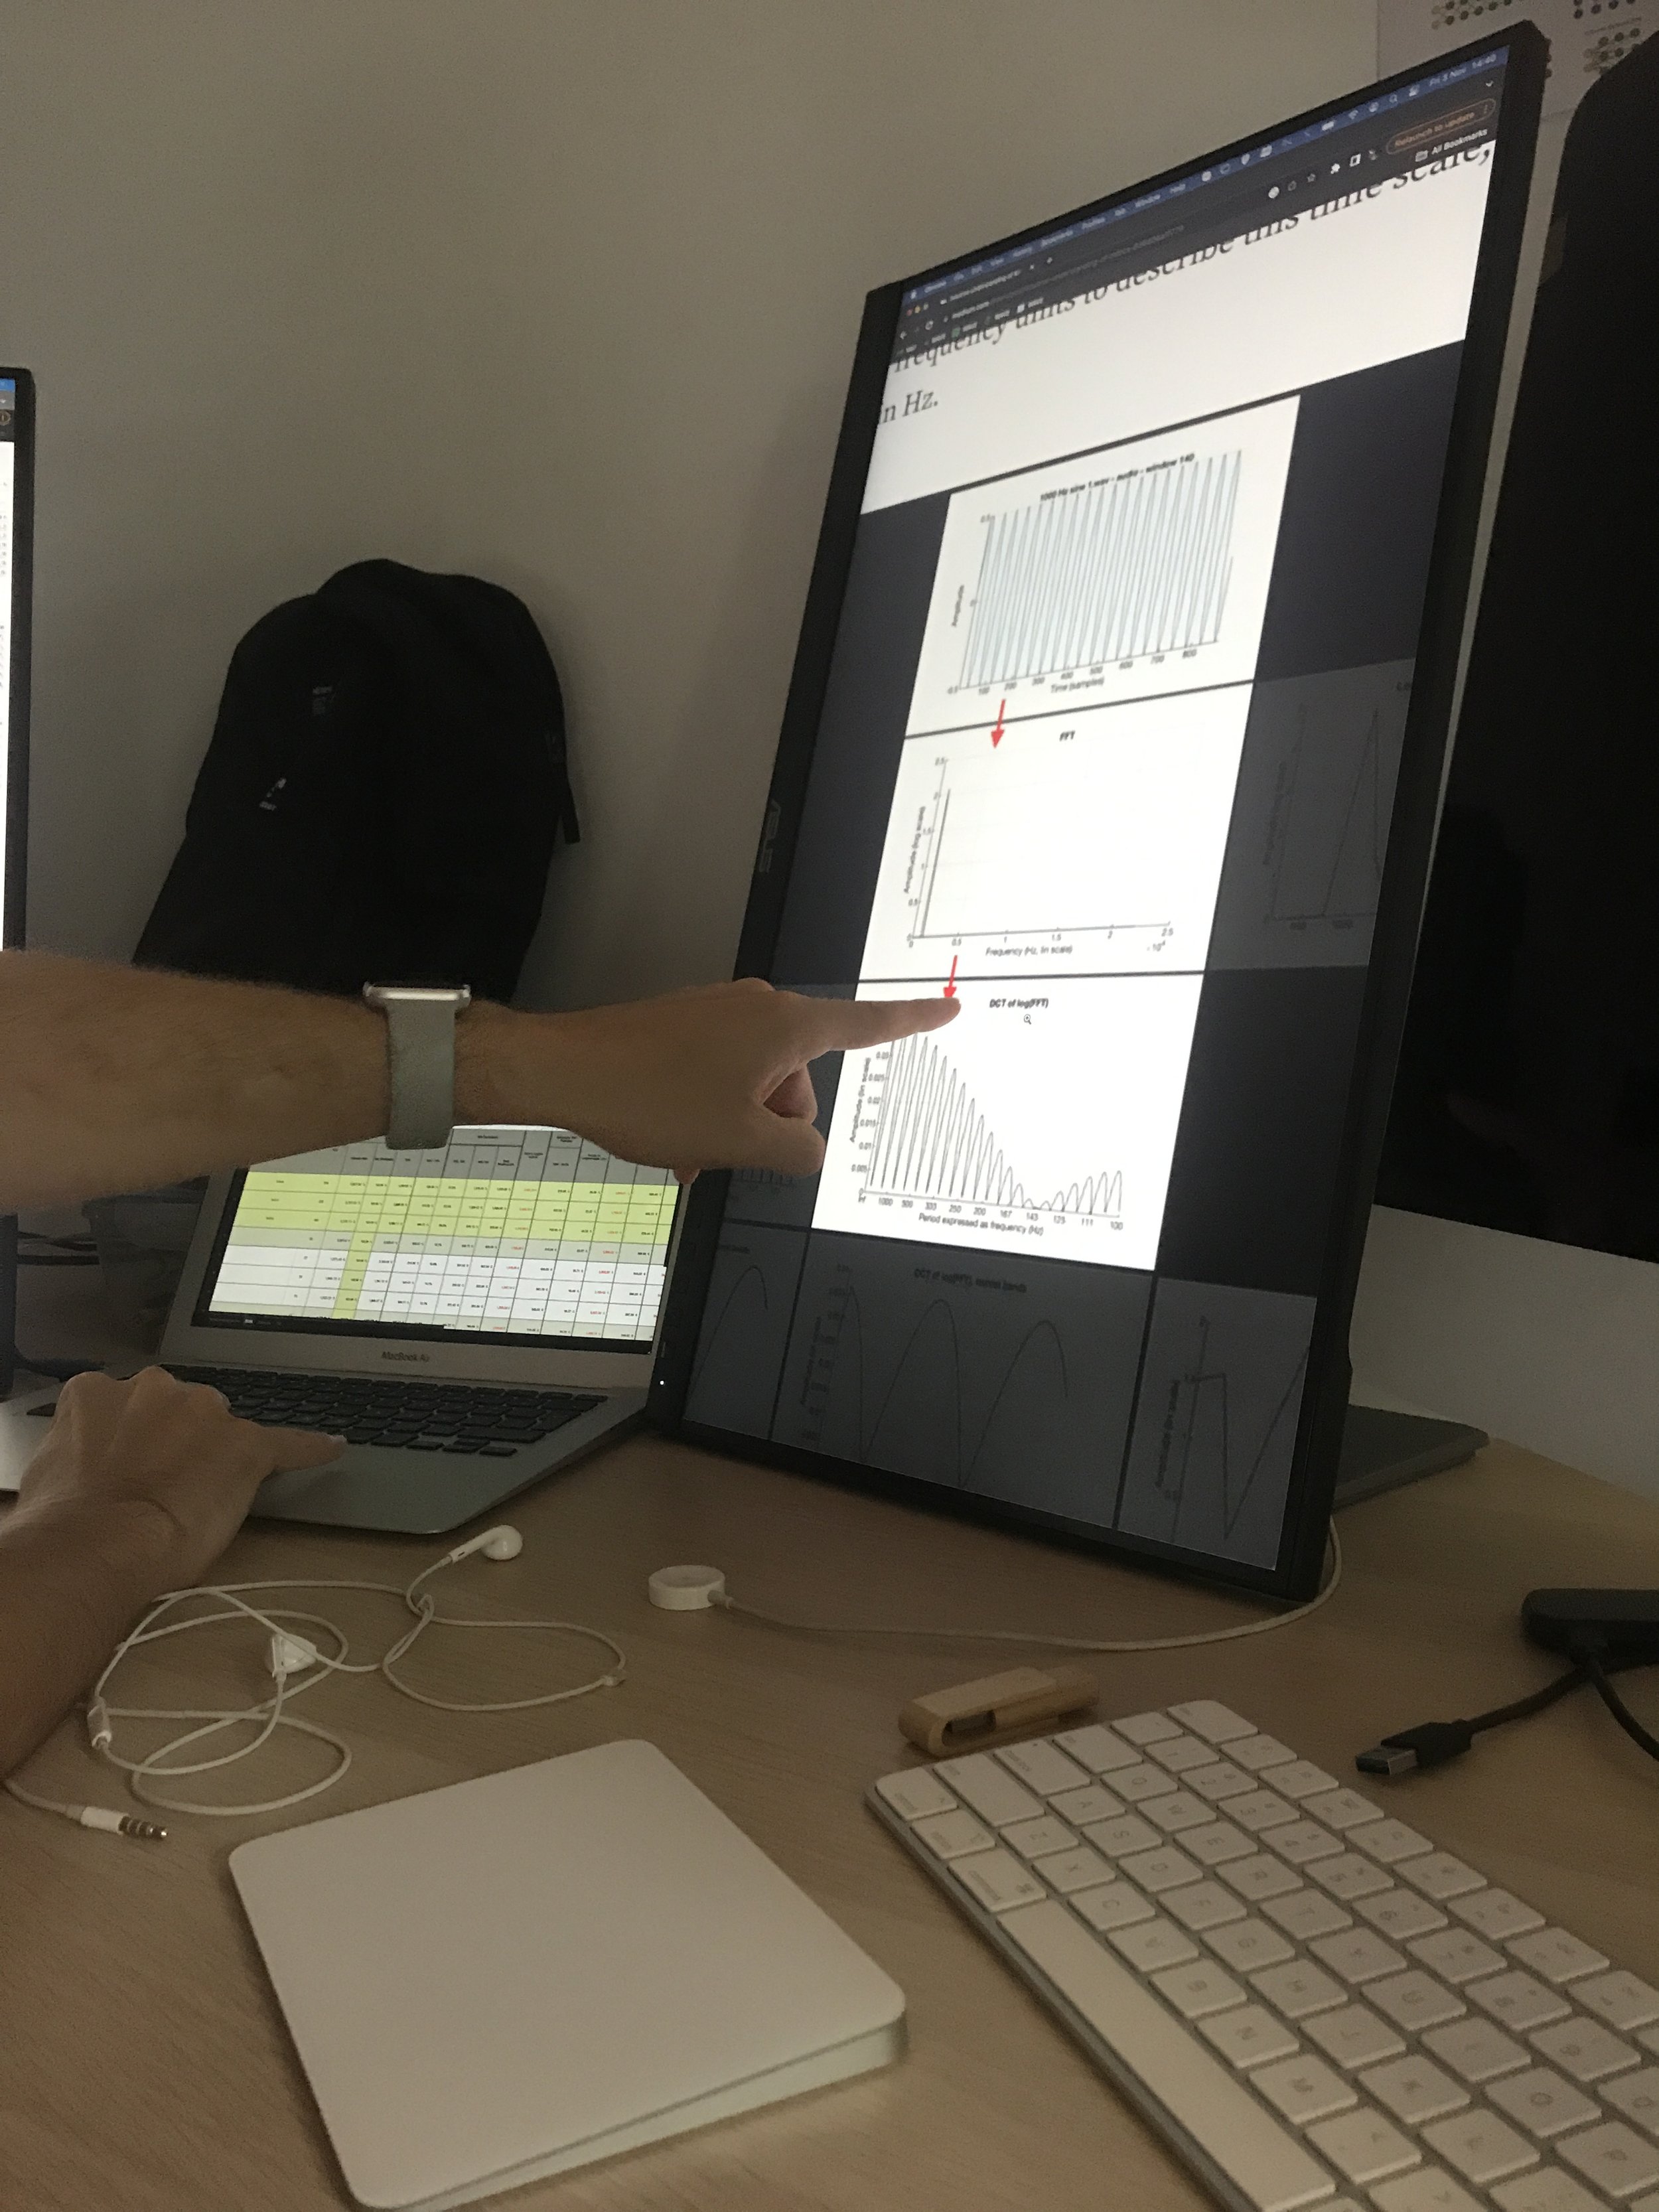
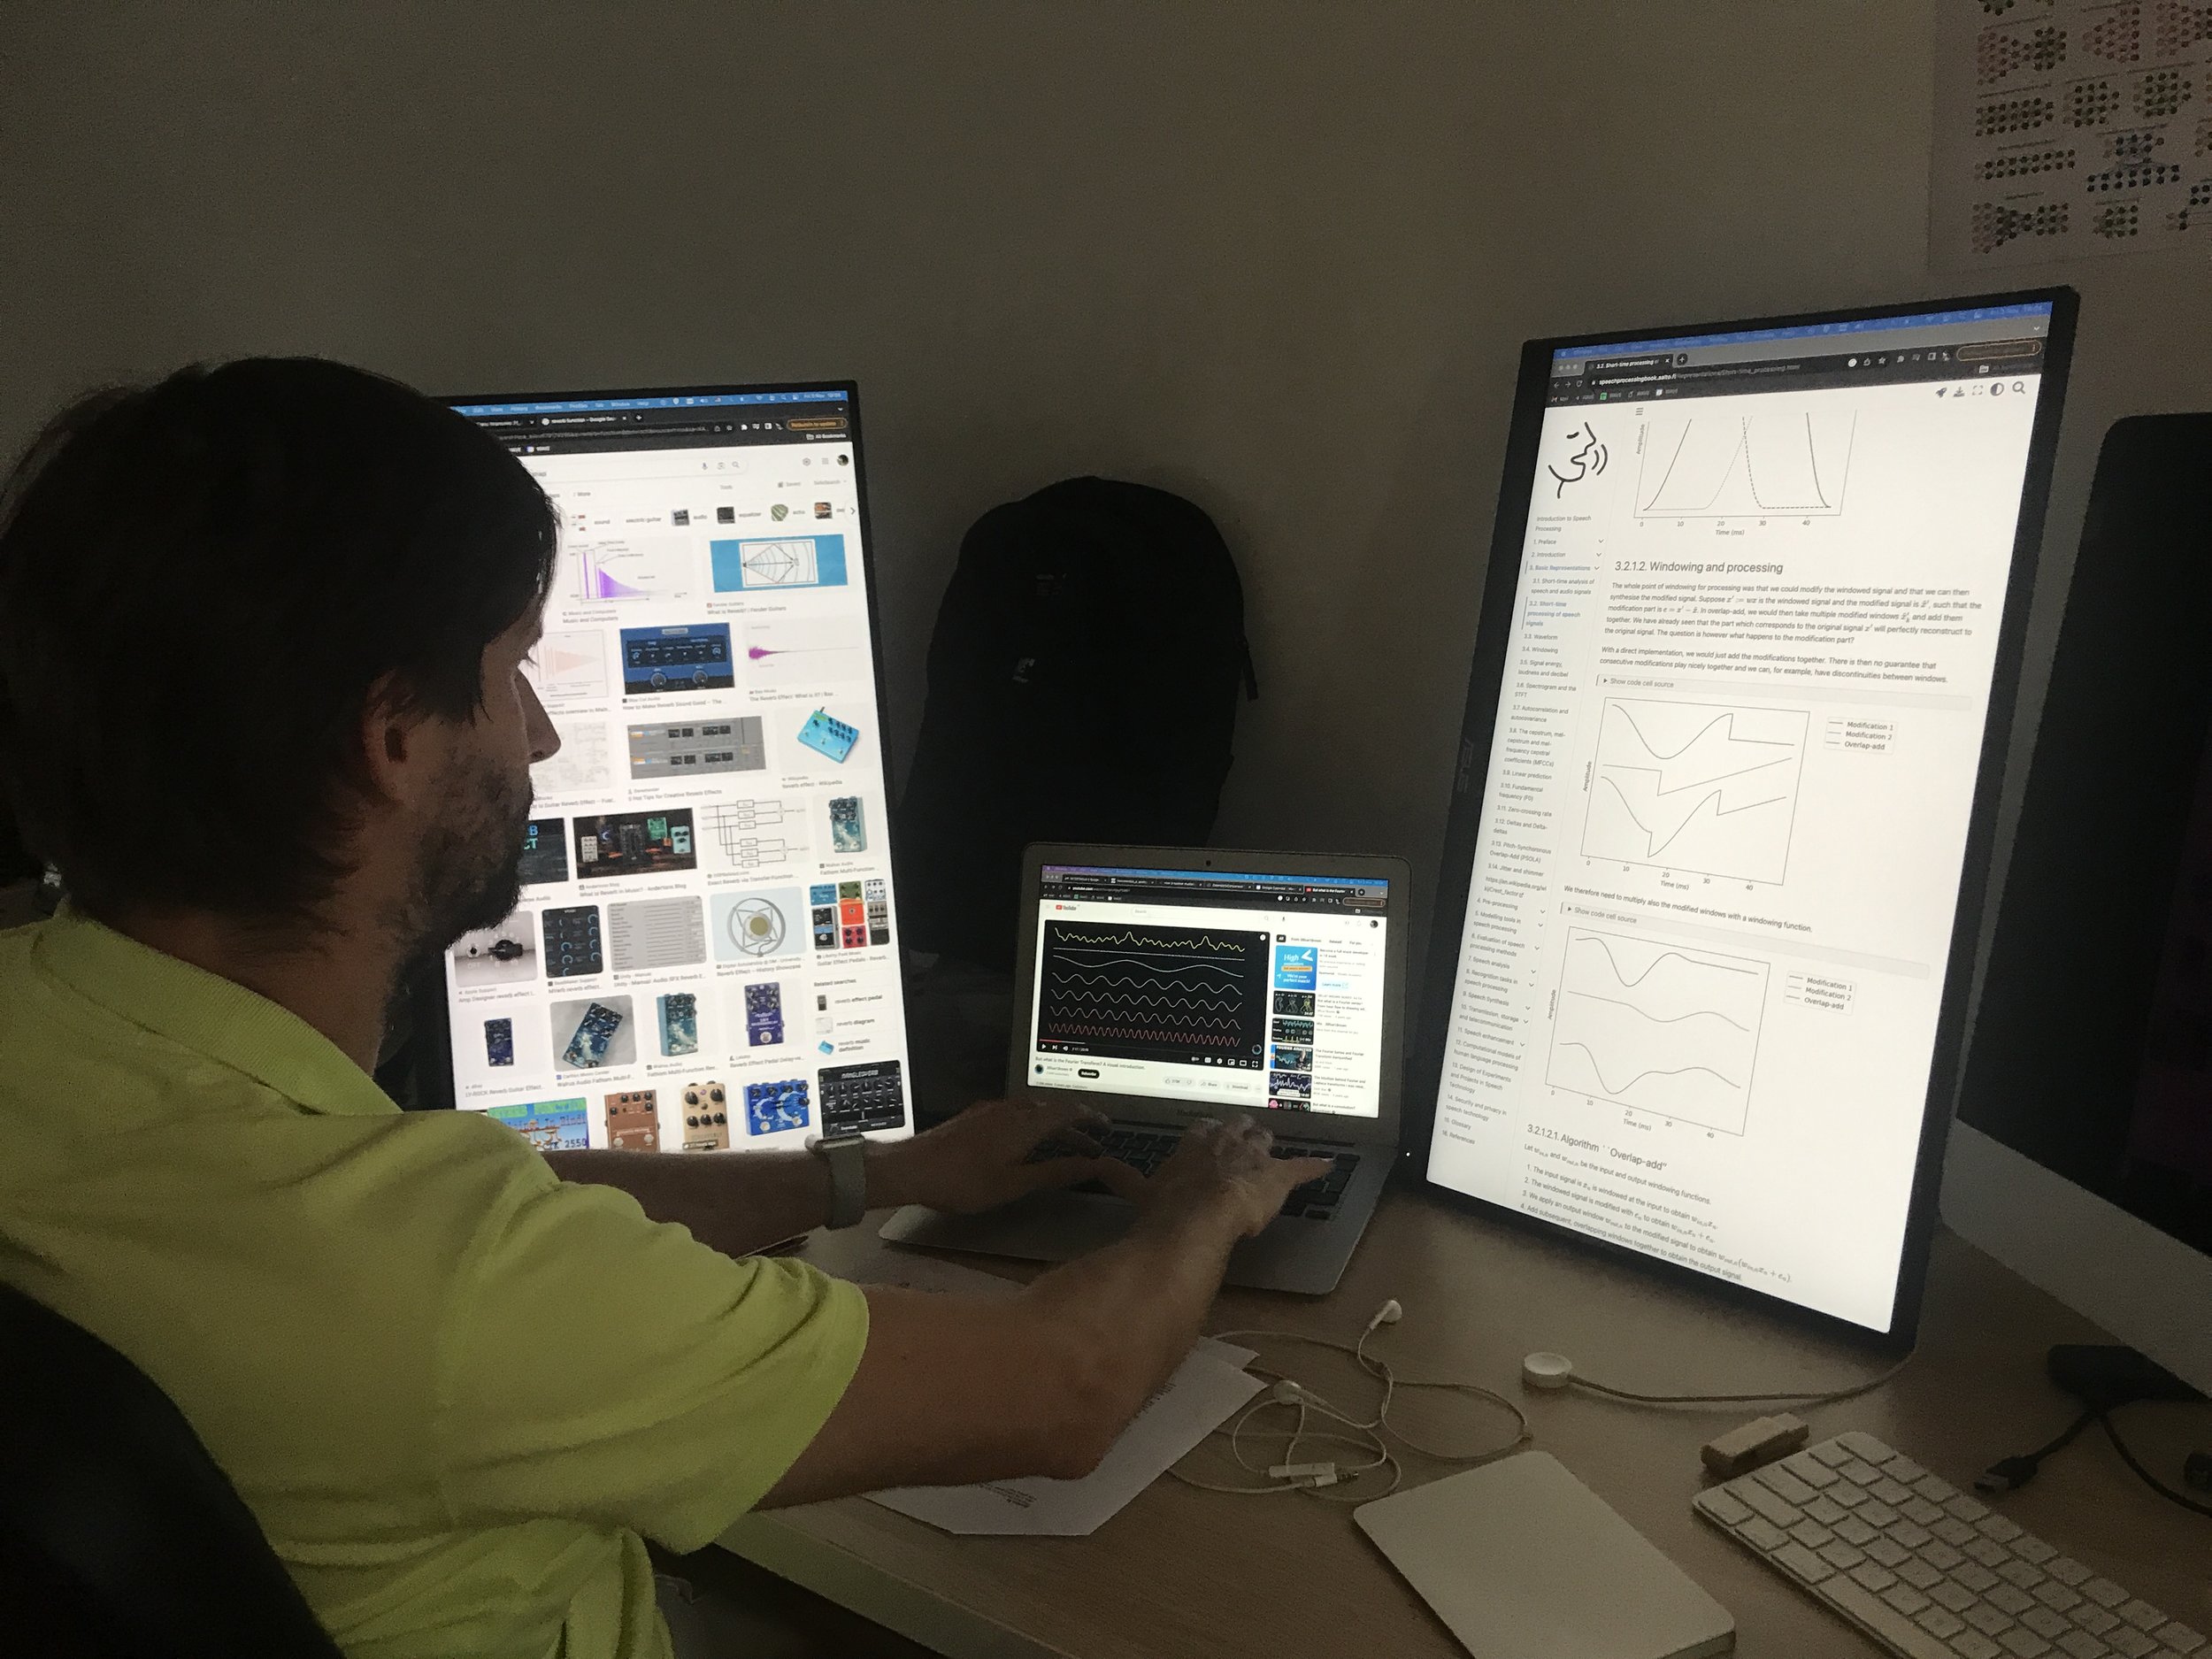
Marko and I ‘debunked’ a website together explaining methods for (speech) audio analysis which may really means he was revising what he already knows at the same time as explaining it to me. It was really interesting to learn how this conversion is done to get from an audio sample to a spectral analysis. Although the website was focused on speech analysis, the methods can be generalised.
To recap: Wave form visualisation is the one I’m more familiar with already, which just shows amplitude and time.
DCT (discrete something or other…) digs in to is shown in the spectrum (the summed visualisation) to show the frequencies in any sample (like frame) of the time series (I think!), and the series of these put together over time is like watching a video made from separate frames. So sample rate is equivalent to frame rate. There is some rule which says that you can only use a sample rate that is half the original recording sample rate otherwise artefacts appear. It’s something to do with the way the thing is constructed - the artefacts are caused by overlaps I think. I didn’t fully understand this part yet.
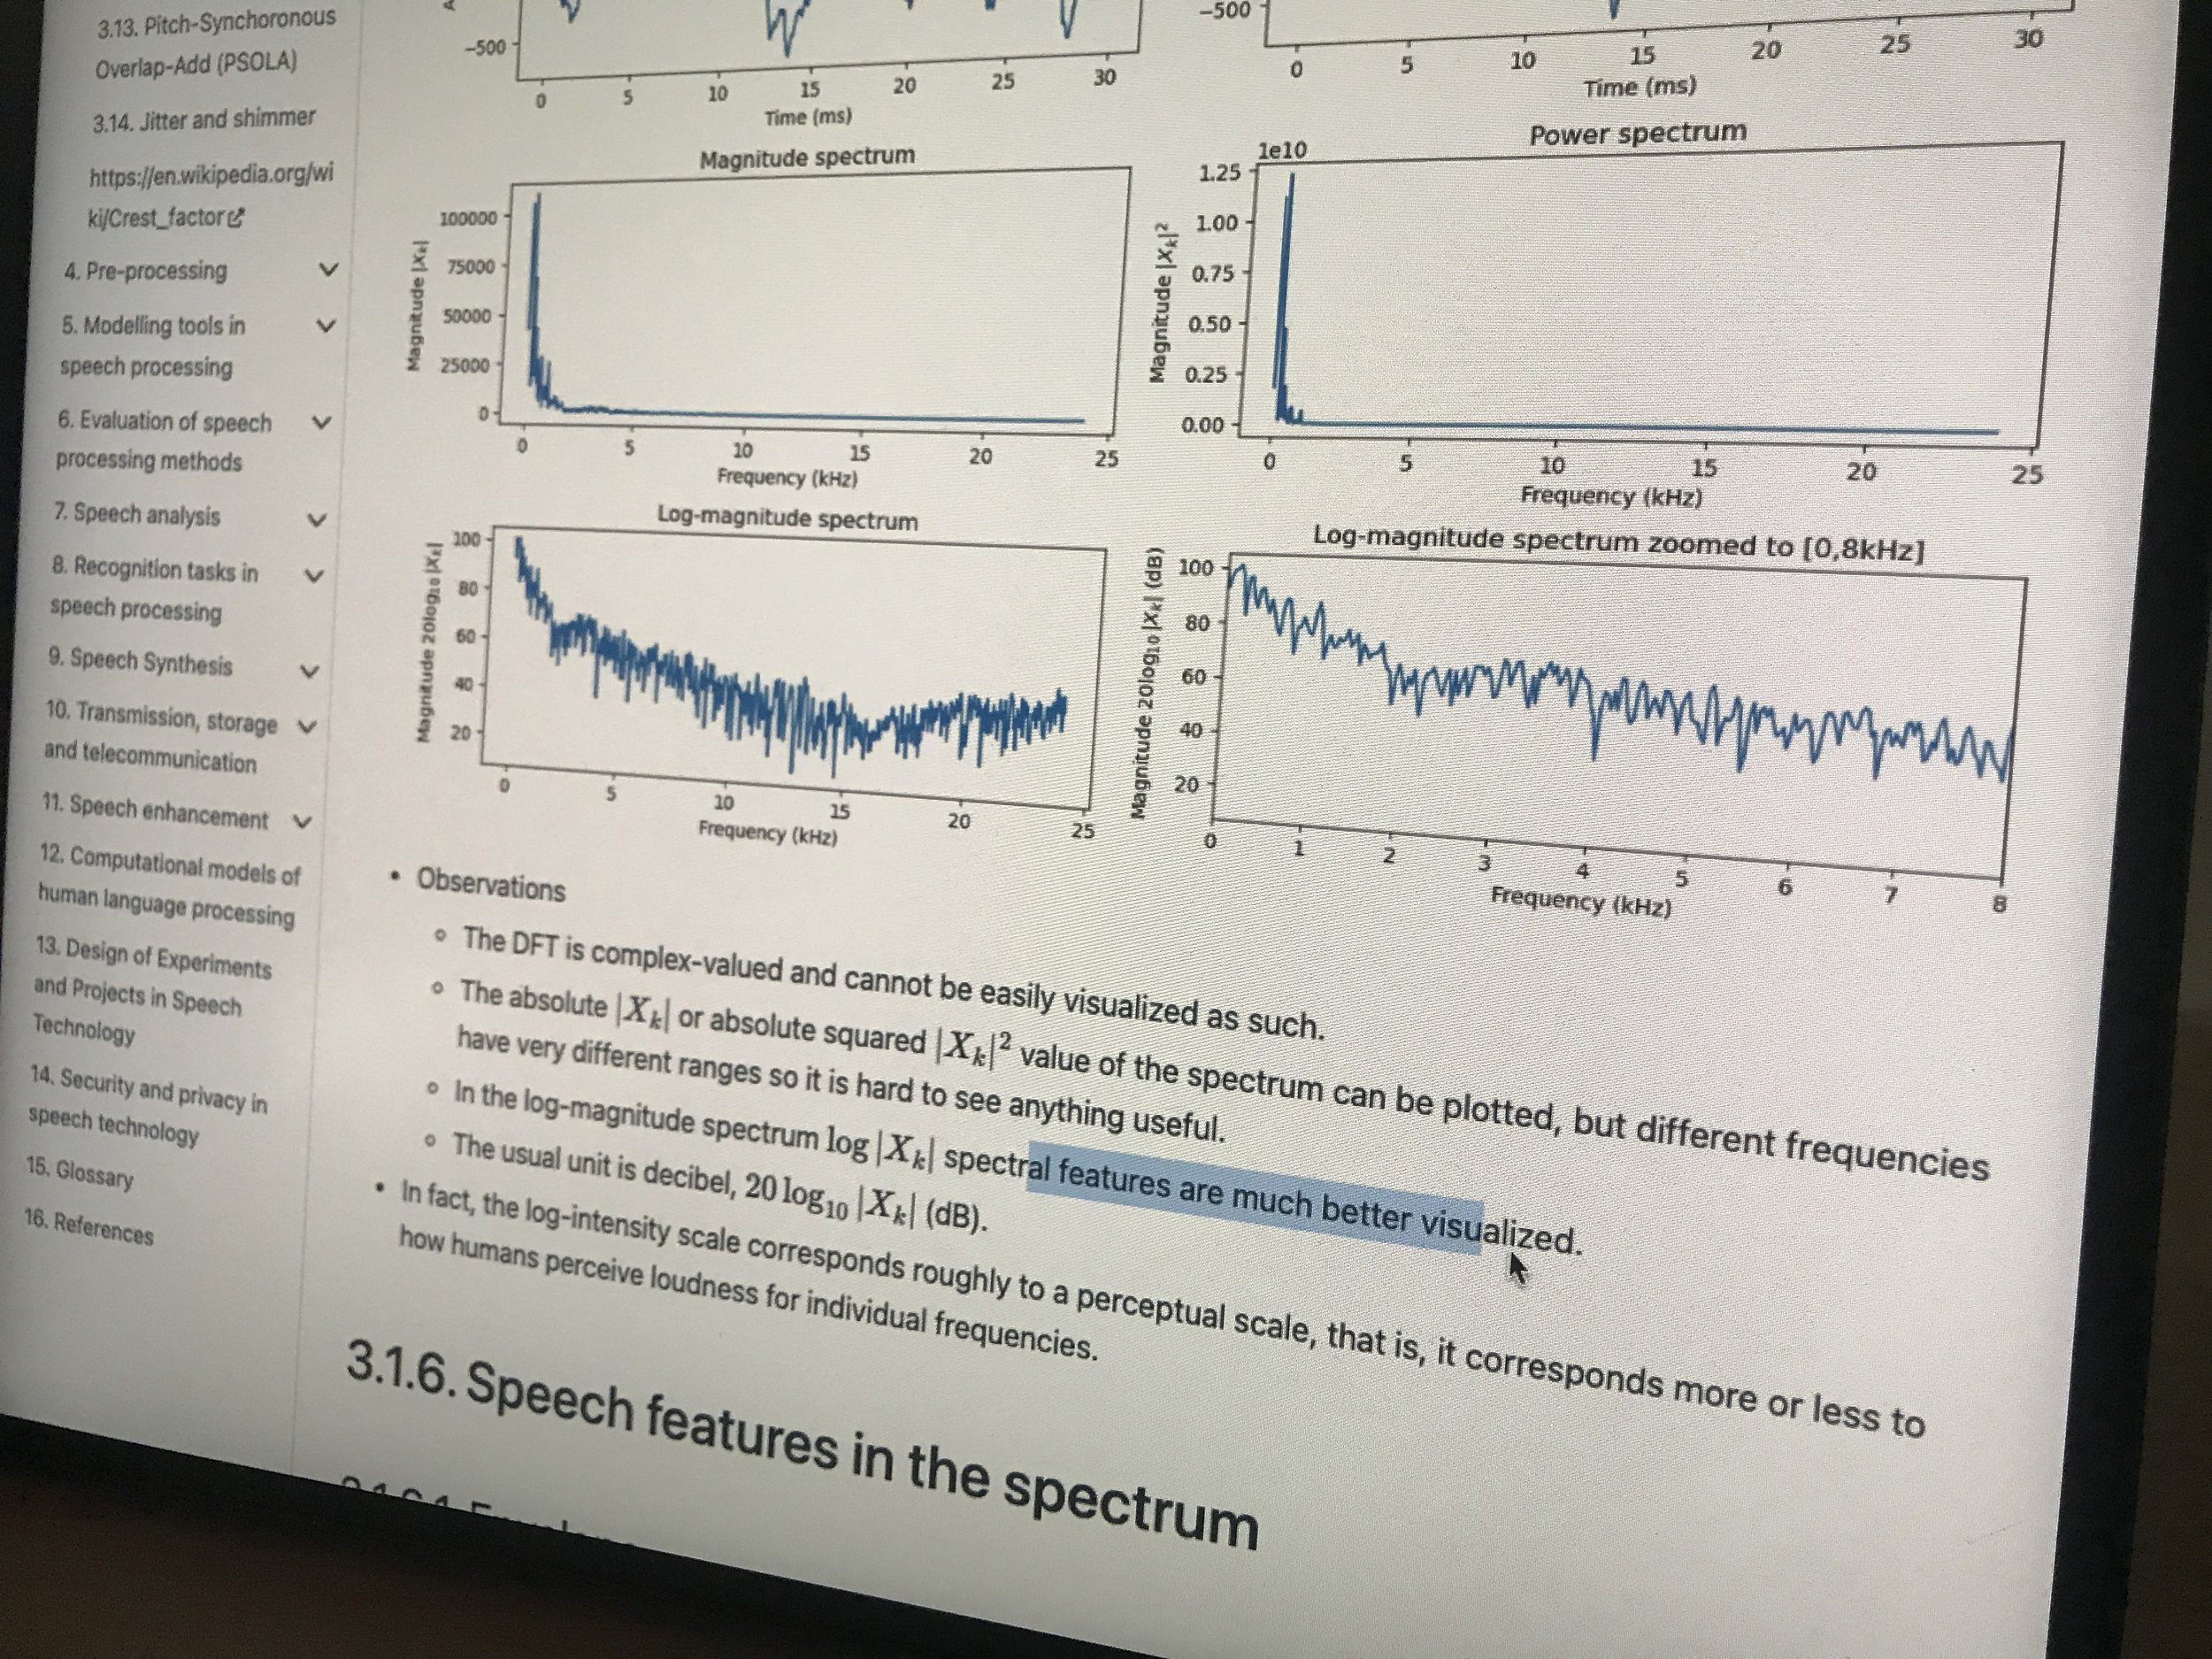
Simplest takeways for me are the differences between using fourier transformation to see the frequencies for either a spectrum or a spectrogram. The spectrum is a sum of all the frequencies collated into one graph, so you can see the dominant frequency in any chosen sample; whereas a spectrogram shows the frequencies across time and often also the amplitude or intensity (through colour).
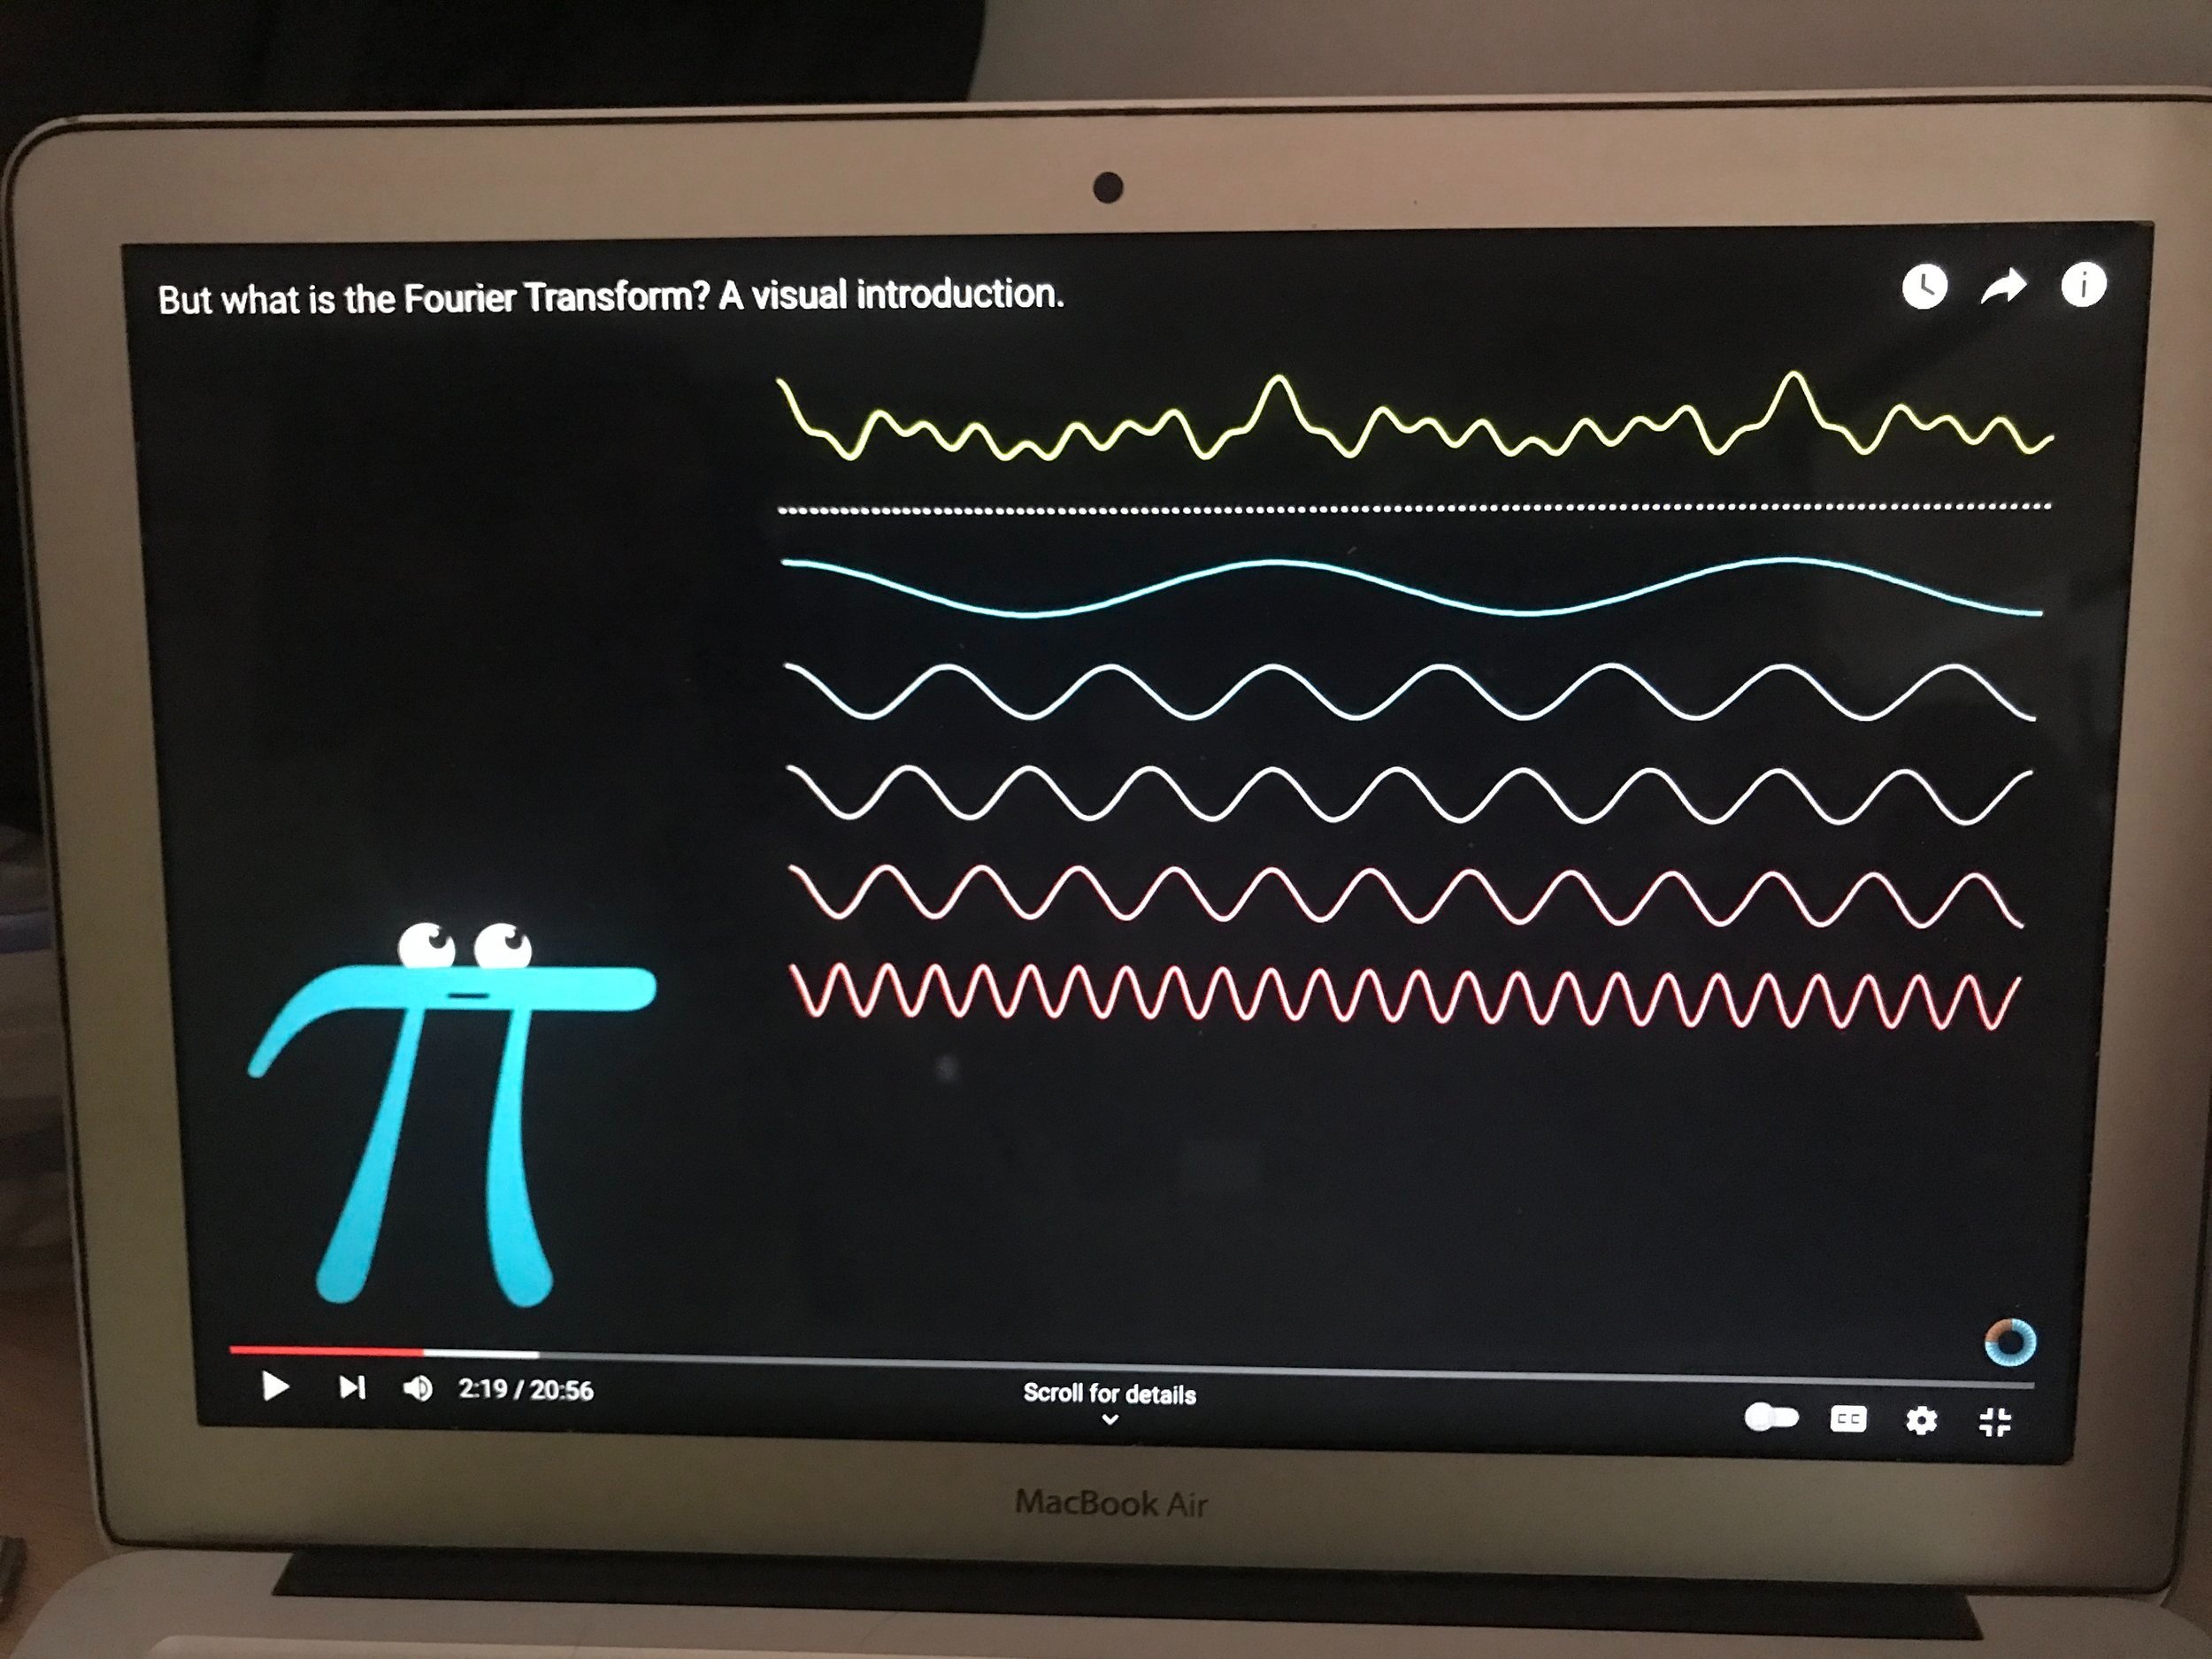
The other really simple but kind of mind-blowing concept was seeing how one audio signal (say a note or melody) can be separated out into its harmonics. The third image here shows how the complex wave form (at the top of the screen) can be reverse engineered to find its component parts. We discussed harmonics a little. Every note has a main frequency and also smaller ‘side’ frequencies which are the harmonics. These are listed as first, third, fifth etc. in terms of which is closest to its foundational frequency.
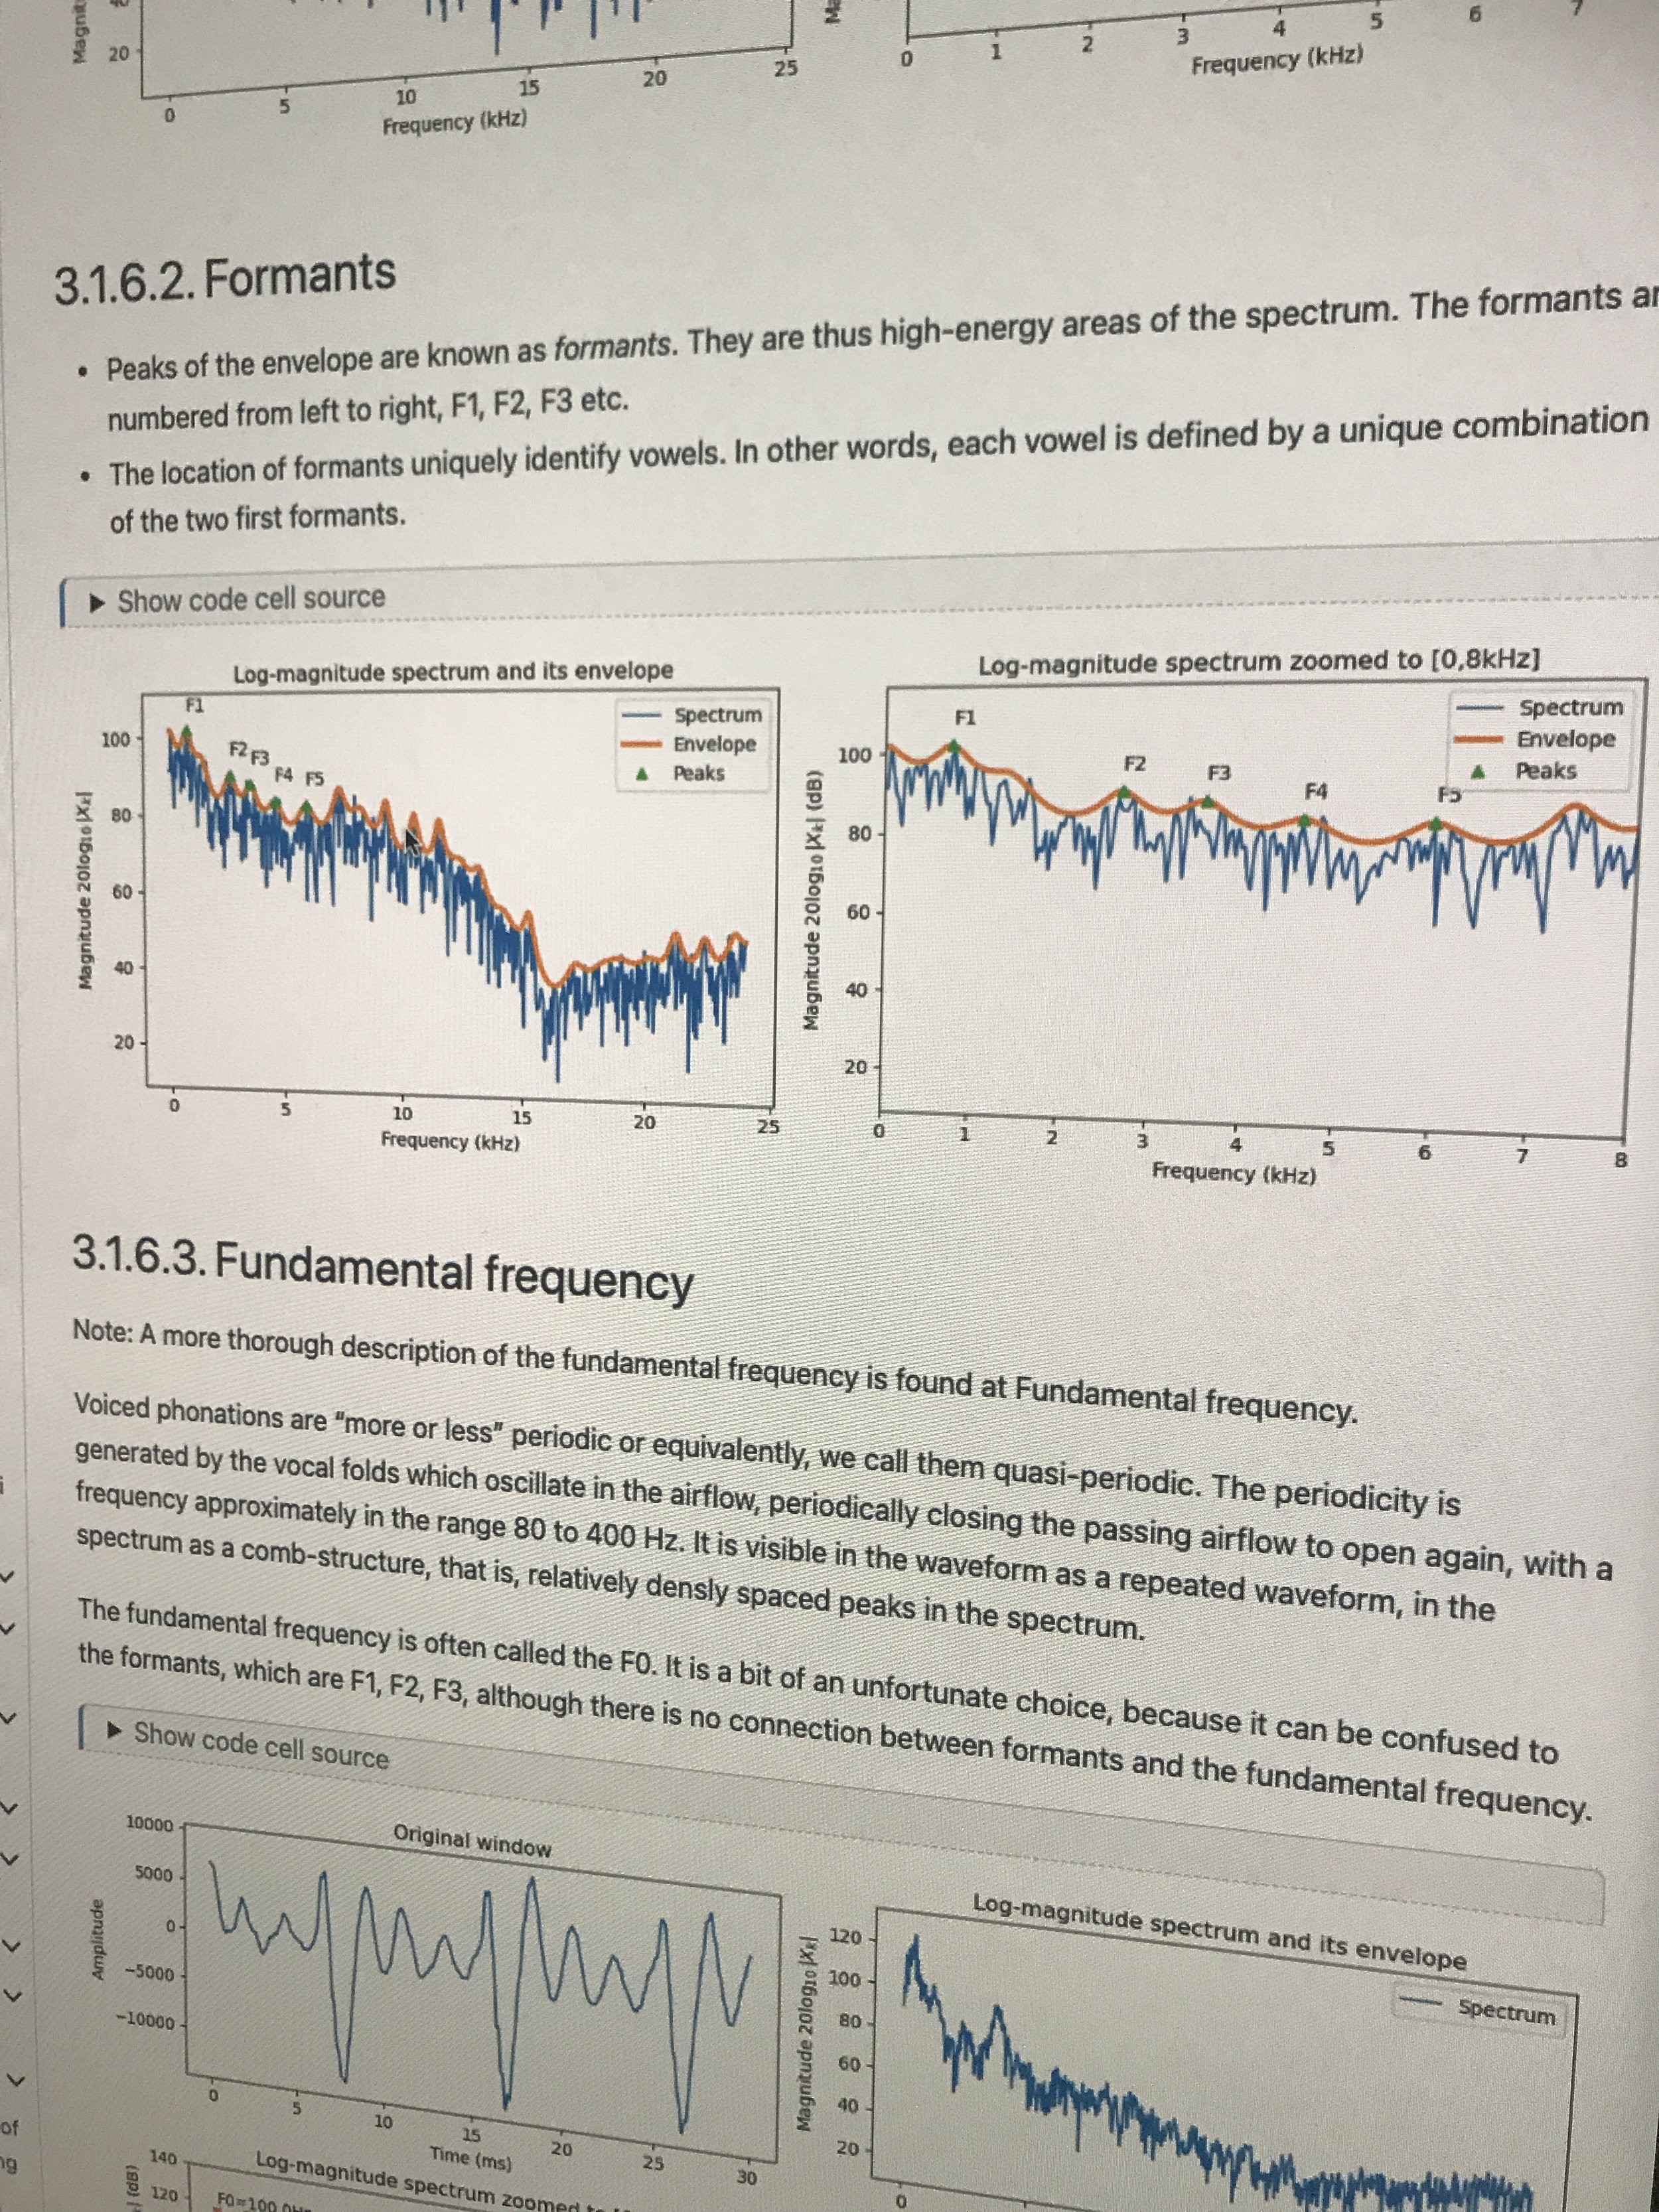
I also learned the term ‘envelope’ which is like a top line over the peaks of a signal, and how diferent log scales are used in different circumstances.