(To the Beat of) The Silent Moon: A work in progress
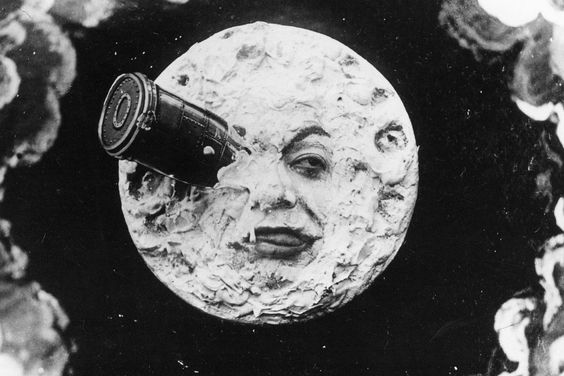
Georges Méliès 1902 ‘A Trip to the Moon’
This post contains three extracts of sonified* tidal data. These are an experiment in making audible the rhythmic, cyclical patterns of the tides, in order to highlight the moon’s interaction with the earth.
I’m interested in the complex inter-relatedness of the physical world and how even phenomena which are distant or invisible can have a tangible effect on our day to day lives. I’m fascinated by the moon as a visual phenomenon and intrigued by the multiple meanings projected onto its silent image across cultures and over time.
Our relationship with the moon-as-image may be a little one-sided, but there are other ways the moon’s presence can be felt.
Listeners are invited to imagine what a conversation with the moon might sound like.
Track List
1. Lochmaddy, North Uist, the Western Isles, Scotland. 58”
2. Glasgow, Scotland. 58”
3. Arbroath, North East Coast, Scotland. 18”
*Sonification: The use of non-speech audio to perceptualise data.
Interpretation of data through sonification has existed since the invention of the Geiger counter in 1908. The bleep of the hospital heart monitor is another familiar example.
Data sonification, though somewhat controversial, has recently gained ground in science as an alternative to visual representation when analysing complex data. Arguably, it is capable of revealing different properties from visualisation, and of exploiting the human ear’s excellent capacity for filtering sound. Sonification may also have exciting potential for visually impaired researchers.
However, it is the poetic potential of sonification – its ability to connect with emotion, fire the imagination and stimulate thought – that has inspired this experiment.
Process:
Tide tables are available online for coastal locations throughout the world. They allow us to anticipate with accuracy the times high and low tide will occur, and to what levels they will reach (barring unusual storm surges).
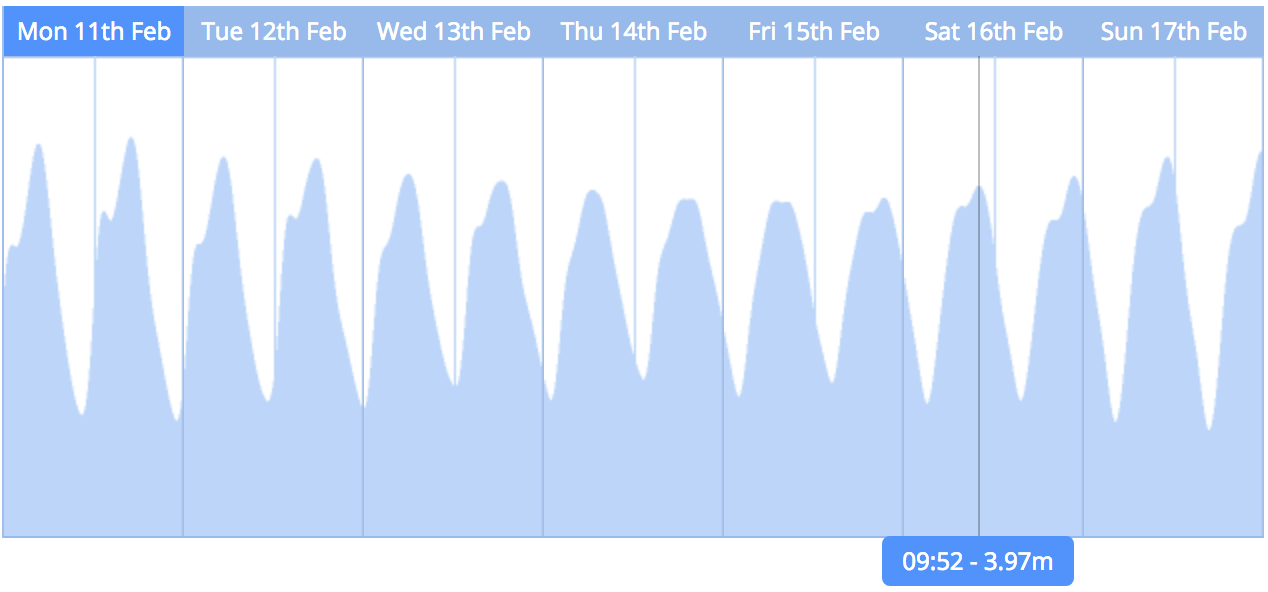
Graph detail from website www.tidetimes.org.uk/glasgow-tide-times
I took data from tide tables across a period of 29.5 days – a lunar month – in January 2019, and plotted the times of low and high tides on to fifty-nine twelve-beat bars, where one beat represents an hour, and two bars represent a twenty-four-hour period. The levels of the tides are plotted as whole notes (no sharps or flats) with one note covering 10cm of tidal rise. For example, middle C (C3) on the piano was assigned to represent 2.8m. (NB: Arbroath track only represents an an eight-day period.)
This mapping on to the keyboard is arbitrary in terms of its starting point, but the intervals and rhythms thereafter are dictated by the patterns established by the tides. So, although what you are hearing bears no relation to the sound of the the sea (which is mostly, of course, the sound of the waves) the pattern of notes reflects the pulses and intensities of individual coastal locations – albeit on a vastly speeded up scale.
I selected Lochmaddy and Arbroath because of their locations on the west and east coasts, and Glasgow because I noticed an interesting phenomenon (see fig two) that I hadn’t seen on the beach locations I’d looked at. At times, on the rising tide, Glasgow exhibits an extra mini high tide that recedes momentarily, before continuing with its normal rise. I wanted to know what this would sound like if I included these mini high tides as extra notes in the composition.

Screenshot showing high tide points for Glasgow during Dec/January plotted as midi notes (notes below F4 are extra ‘mini high tides’)
Future development:
These audio extracts are very basic. They are part of the beginnings of a larger moving image/sound installation project exploring the materiality of the moon and how it connects to the cyclical, repetitive patterns of lived experience.
Although for ease of creation, the data has been plotted using 12 beat bars reflecting our twelve-hour day, I have allowed the lunar rhythm to adhere to it’s own slightly longer structure – 12 hours and 25 minutes. It might be interesting, therefore, to try including a control beat so that the lunar rhythm can be perceived in relation to diurnal time which more directly governs our lives.
I’d like to experiment with adding moon phase information in some form, or adding some kind of tonal presence for moon and sun rise and set as well as trying different instrumentation in order to to hear what combining tidal data into regional ‘orchestras’ might sound like.
I’m aware that in these three compositions the extremes between high and low tide mean that many of the lower notes are barely audible. This 10cm per note transposition certainly won’t be adequate for the more extreme tidal ranges (such as that of the River Severn in England, which at 15m is the third highest in the world).
So far I’ve plotted the data by hand which is incredibly time consuming. I would be interested to collaborate with computer scientists and musicians to explore the idea further and I’d eventually like to create a tidal rhythms app, available for public use, that would be capable of creating a unique signature tune for any tidal location in the world.

Work in progress installed at Sound Thought Festival, CCA Glasgow, February 2019